
Genetische Charakterisierung der Mini-LEWE Population als Ressource für die experimentelle Forschung
Berliner und Münchener Tierärztliche Wochenschrift 133
DOI: 10.2376/1439-0299-2020-15
© Schlütersche Verlagsgesellschaft mbH & Co. KG. 2018
Publiziert: 08/2020
Summary
The Mini-LEWE, a miniature pig used as an animal model in experimental research, was originally bred in the former German Democratic Republic (GDR) for various test facilities. Nowadays, the Mini-LEWE is maintained as a small but special population at the Farm for Education and Research Ruthe (LFG Ruthe) of the University of Veterinary Medicine Hannover primarily as animal model for transplantation and surgery research. In this study, we performed an analysis of the genetic structure of this rare population, including the start-up population of 15 Mini-LEWE given to the LFG Ruthe from the Humboldt University of Berlin and their offspring. The development of the Mini-LEWE population as well as its genetic relationships and differentiation compared to 155 individuals belonging to four different pig populations, historically related to the Mini-LEWE, were investigated. A comparative genetic diversity analysis in Mini-LEWE showed a nearly complete preservation of the genetic diversity of the start-up population in the offspring resulting in a nearly constant level of genetic diversity during the last 15 years in this population. The Mini-LEWE and the Göttingen Minipig as well, another animal model for experimental research, showed a similar diversity level. Furthermore, genetic relationship analysis revealed the Mini-LEWE as a closed population, separated from historically related pig populations. A great distance was found in Mini-LEWE to the Göttingen Minipig, as well as to Leicoma and Large White. The genetic separation of the Mini-LEWE from these historically related populations emphasized its value as a genetic resource of versatile use as animal model.
Zusammenfassung
Das Miniaturschwein Mini-LEWE stammt ursprünglich aus der ehemaligen Deutschen Demokratischen Republik und wurde dort als Tiermodell für die experimentelle Forschung in verschiedenen Einrichtungen eingesetzt. Auch heute noch ist ein Tierbestand vorwiegend für den Einsatz als Tiermodell in der Forschung zu Transplantationsmedizin und zu Chirurgie auf dem Lehr- und Forschungsgut Ruthe (LFG Ruthe) der Tierärztlichen Hochschule Hannover verfügbar. In vorliegender Studie untersuchten wir die genetische Struktur dieser besonderen Population, bestehend aus 15 Ausgangstieren, die ursprünglich von der Humboldt Universität Berlin an das LFG Ruthe übergeben wurden, sowie deren Nachkommen. Die Entwicklung der Mini-LEWE Population selbst wie auch die genetische Verwandtschaft und Differenzierung von Mini-LEWE zu 155 Individuen vier verschiedener weit entfernt verwandter Schweinepopulationen wurden analysiert. So konnte innerhalb der Mini-LEWE-Population ein fast vollständiger Erhalt der genetischen Diversität der Ausgangspopulation in den Nachkommen fast konstant über 15 Jahre hinweg nachgewiesen werden. Die Mini-LEWE wie auch die Göttinger Minipigs, ein weiteres Tiermodell in der experimentellen Forschung, zeigten eine vergleichbar hohe Diversität. Darüber hinaus zeigte sich in der Verwandtschaftsanalyse, dass die Mini-LEWE eine für sich geschlossene Population darstellen, die sich deutlich von entfernter verwandten Rassen differenziert. Eine große Distanz zwischen den Mini-LEWE zu dem Göttinger Minipig, wie auch zu Leicoma und Deutsches Edelschwein, konnte nachgewiesen werden. Diese deutliche genetische Differenzierung von entfernter verwandten Rassen unterstreicht den Wert der Mini-LEWE-Population als eine genetische Ressource für den vielseitigen Einsatz als Tiermodell.
Introduction
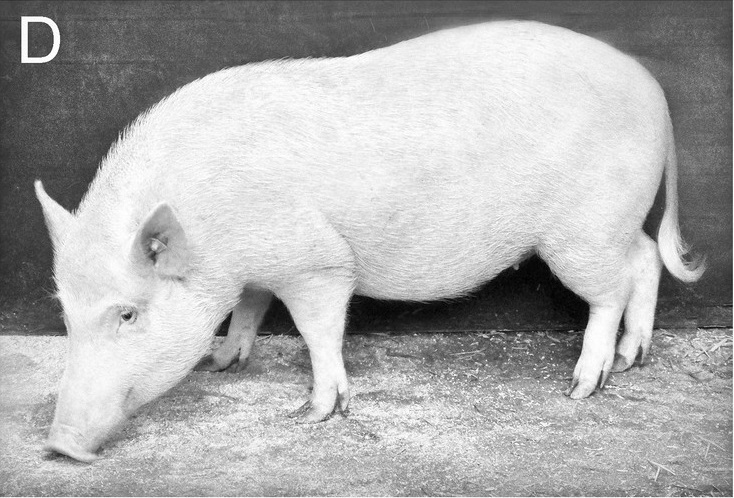
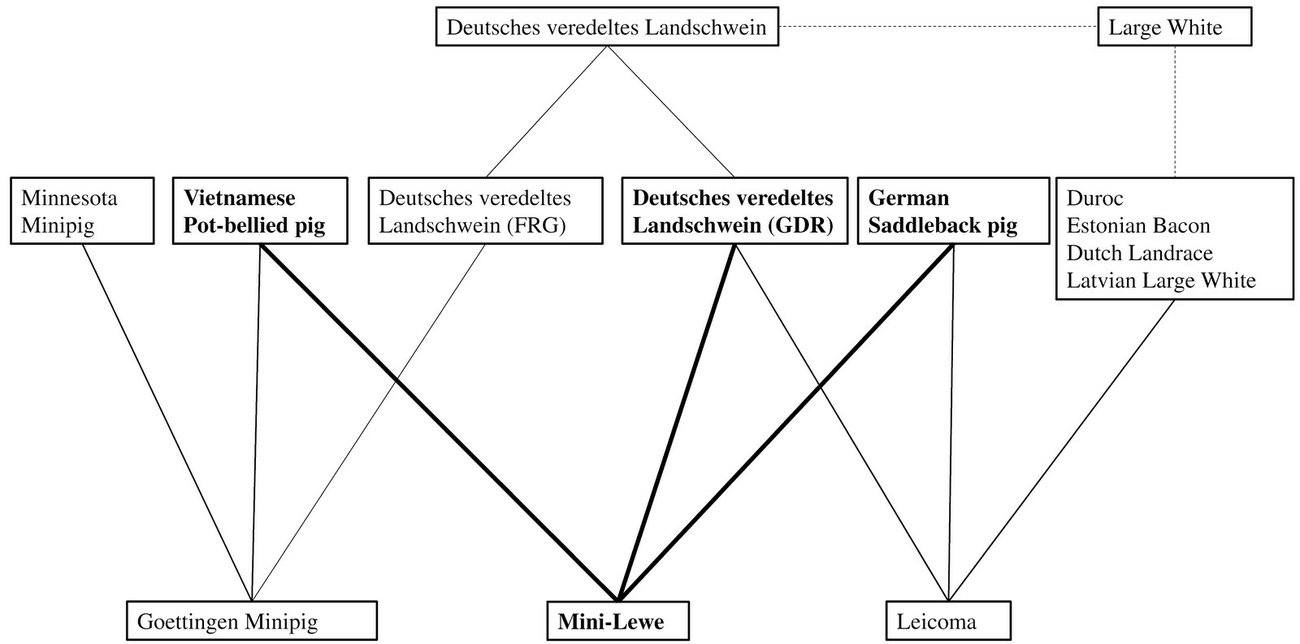
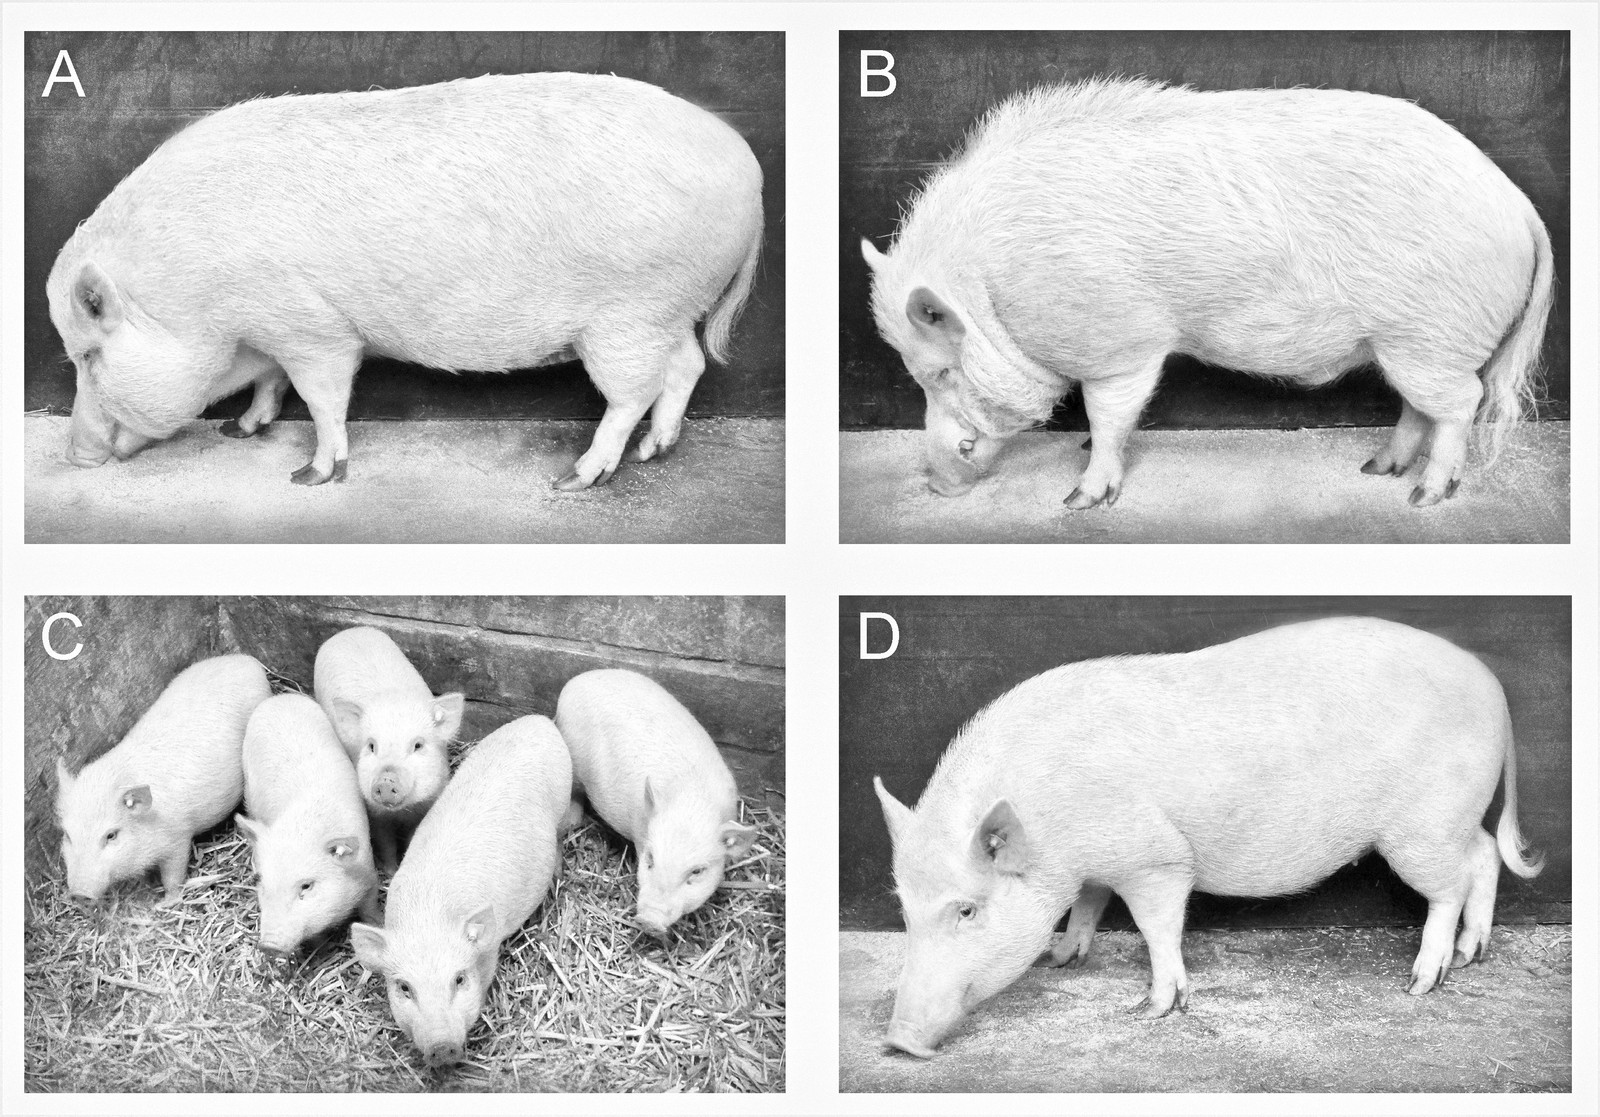
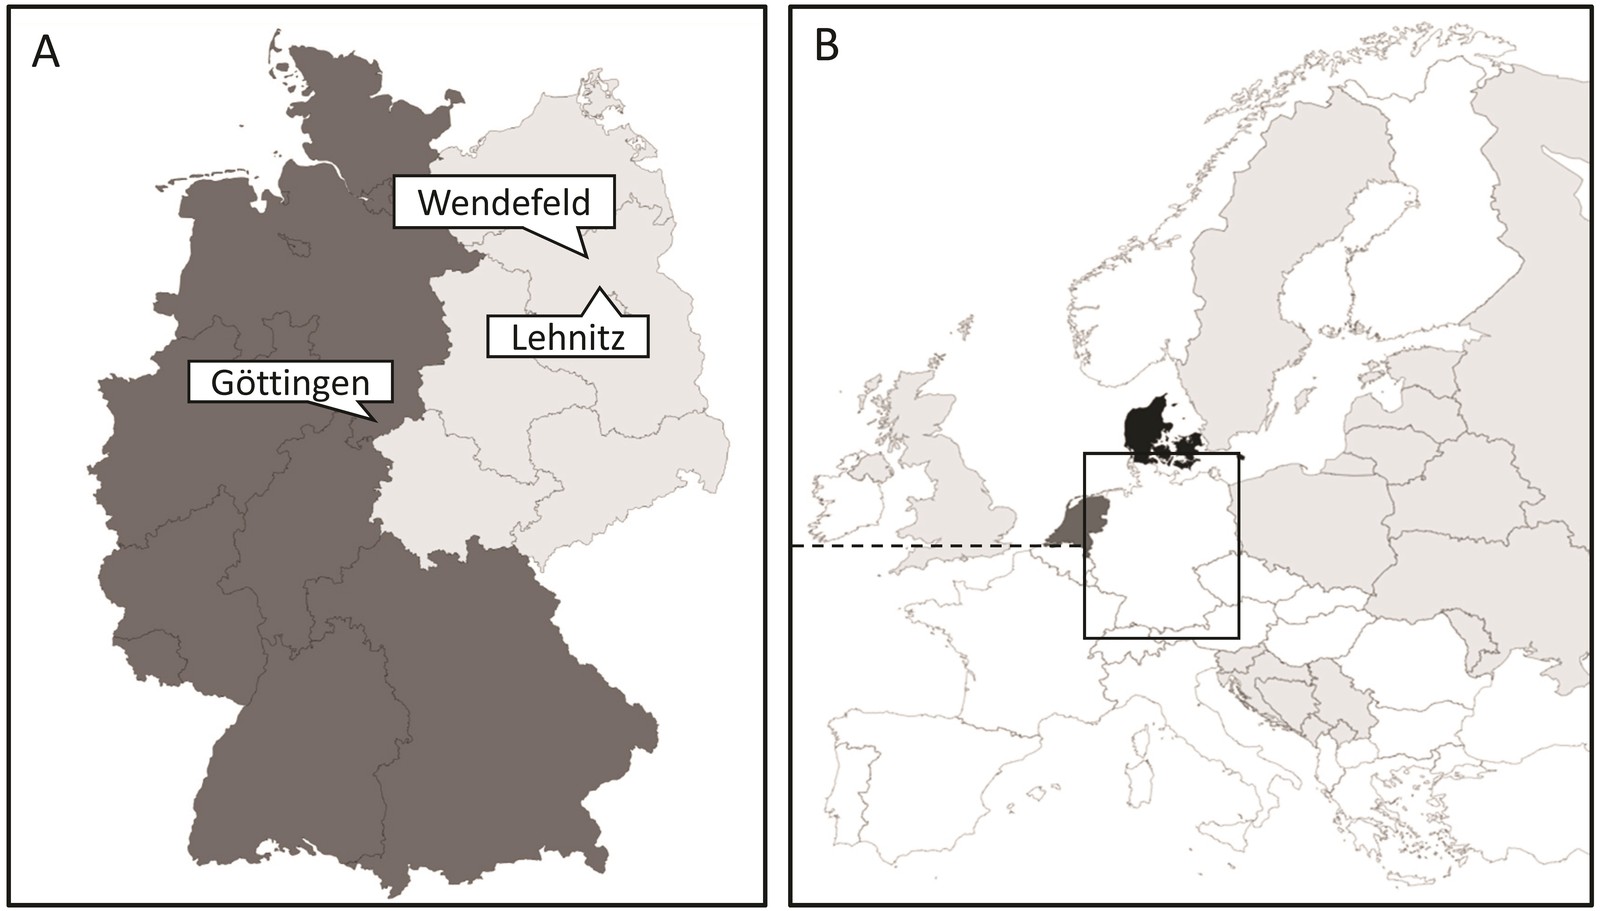
Miniature pigs constitute a highly attractive animal model for experimental research, particularly due to their advantageous body size for husbandry and management in test facilities (Panepinto 1996). Several breeds have their origin in the US like Minnesota Miniature pig, Hanford Miniature pig and Yucatan miniature pig or in Asia like the Ohmini- or Clawn Minipig (Gutierrez et al. 2015, Panepinto 1996). The first miniature pig in Europe was established in the territory of the Federal Republic of Germany (FRG) as the Göttingen Minipig (GöMi) (Köhn 2011), nowadays one of the most commonly used minipig for biomedical research (Gutierrez et al. 2015). Another less well known, but specialised miniature pig population was established in the former German Democratic Republic (GDR), referred to as Mini-LEWE (MiLe) (Figure 1) (Gregor 1976). LEWE is deduced from the former breeding locations Lehnitz and Wendefeld (Leucht et al. 1982). The breeding program for MiLe started as early as 1965 at the outpost Lehnitz of the Institute for Animal Breeding and Domestic Animal Genetics of the Humboldt University at Berlin in the GDR (Busse 1967). A phenotypically white boar, which was a descendant from a cross between a German Saddleback pig and a „Deutsches Veredeltes Landschwein“ (DvL), since 1968 known as German Landrace (Comberg et al. 1978), was mated with Vietnamese Pot-bellied sows (Leucht et al. 1982) (Figure 2). These founder breeds from MiLe also contributed to the GöMi population (Glodek 1981) and as well as to Leicoma (Leico), a synthetic dam line bred in the former GDR between 1971 to 1986 (Pfeiffer 1980). Leico was used for a hybrid-breeding program with German Landrace and German Large White and nowadays is classified as an extremely endangered population (GEH 2020). However, different DvL populations, DvL in GDR for MiLe and Leico as well as DvL in FGR for GöMi were used as founder breeds, which were highly influenced by various Landrace genetics imported from different countries to FRG or GDR aiming at a higher production of lean meat (Comberg et al. 1978, Pfeiffer 1980, Schwark et al. 1975) (Figure 3). In general, nowadays herdbook breeder organisations are working on a regional level (Wähner 2012), suggesting that a certain differentiation of German Landrace and German Large White between Eastern and Western Germany persisted until now.
The first generation of the MiLe population with 50% genetic contribution from Vietnamese Pot-bellied pig and each 25% genetic contribution from DvL (GDR) and German Saddleback was intercrossed as well as backcrossed to Vietnamese Pot-bellied sows for a complete white coat and skin colour and small body size (Gregor and Leucht 1976). Size selection was defined by 140-day-body mass. In addition, important breeding objectives were breeding maturity at five to seven months with a body weight of 20 kg, large ears with pronounced veins and a balanced character. Finally, in 1975, the MiLe population was consolidated and then used in different test facilities.
Several reports described phenotypic traits of MiLe like anatomical or histological examination of heart (Schwenke 1998), kidney (Radermacher 1999), hypothalamus (Patzak 1994) as well as haematology parameters (Richel 2015). Furthermore, previous analyses on physical development exhibited the MiLe as fully-grown at the age of 18 to 20 months (Gundlach 2012, Richel 2015). The MiLe was defined as the second smallest miniature pig behind the white GöMi available for experimental research (Richel 2015). In a phylogenetic study with whole genome sequencing data, two individual MiLe and a pooled sample of ten MiLe, were included (Reimer et al. 2018, 2020). Both miniature pig breeds MiLe and GöMi clustered between the Asian and European pig breeds, but were in clearly separated clusters. A microsatellite study among each two MiLe and two Aachener minipig showed an allele similarity between 33 and 40% (Pawlowsky et al. 2017).
Most of the MiLe population got lost with the demise of the GDR. A small number of animals was rescued at the Humboldt University of Berlin and the original breeding lines were maintained until 2005. Progeny of these remaining breeding animals, including 5 boars and 10 sows born in 2003 and 2004, were transferred to the University of Veterinary Medicine Hannover. Pedigree records provided by the Humboldt University of Berlin proved the parentage from MiLe. This stock of 15 animals built the start-up breeding population (MiLe-SB) and was maintained as a purebred genetic resource at the Farm for Education and Research Ruthe (LFG Ruthe) of the University of Veterinary Medicine Hannover. MiLe offspring is kept primarily for divestment to different test facilities. The main use of MiLe is in surgery and transplantation research (Durisin et al. 2016, Krüger et al. 2016, Zinne et al. 2018). In the course of several transplantation projects, it was shown that MiLe are suitable as animal models due to their diverse SLA-haplotypes. Analysis of pedigree data indicated a low increase in inbreeding and a small increase in effective population size of breeding animals (Schachler et al. 2019). More knowledge on the genetic background and diversity of the MiLe population is important to implement efficient measures for preservation of the population.
The present study provides an analysis of the genetic diversity of the MiLe population. The objectives are to infer the population structure of MiLe and their genetic relationship to pig populations from which founder animals for MiLe originated or which had founder breeds in common like GöMi. Thus, an important issue is the degree of genetic differentiation between MiLe and German Landrace (LREast), Large White (LWEast) and Leico representing pig breeds originated in Eastern Germany. In addition, we wanted to know whether genetic diversity of the MiLe-SB from 2005 was preserved in their offspring.
Top Job:
Top Job:
Material and Methods
Samples and microsatellite genotyping
In total, 212 tissue samples (blood or ear punches), taken from the bio-bank of the Institute of Animal Breeding and Genetics at the University for Veterinary Medicine Hannover, were used in this study. The sample set included 97 MiLe, consisting of 15 breeding animals belonging to the founder population (MiLe-SB) of 2005 and 82 individuals as representative sample of their offspring produced at the LFG Ruthe (MiLe-OF). Out of these 82 individuals, 23 individuals were employed as breeding animals at the LFG Ruthe. Furthermore, 23 GöMi, 23 LWEast and 23 LREast, both bred in Thuringia, and 46 Leico were included in this sample set. Total genomic DNA was isolated using a standard salting out procedure using red blood cell lysis buffer and sodium EDTA buffer.
For genotyping, we selected 40 microsatellites preferably evenly distributed across all 18 autosomes and recommended for diversity studies in pigs (CGA, S0155, SW240, S0002, SW72, SW902, S0097, S0217, S0227, S0301, IGFI, S0005, S0228, SW122, SW2406, S0025, S0101, SW632, SW2410, SW174, SW911, S0070, SW951, S0386, SW2008, S0090, S0143, S0068, S0215, SW769, SWR1941, SW295, SW857, S0355, SW1111, SW936, S0026, SW742, SWR1004, SW787) using a former database (http://www.projects.roslin.ac.uk/pigbiodiv/; see also Alexander et al. 1996a, b, Coppieters et al. 1993, Ellegren et al. 1994, Ellegren et al. 1993, FAO 2004, Fredholm et al. 1993, Heyheim et al. 1994, Jung et al. 1994, Riquet et al. 1995, Robic et al. 1994, Rohrer et al. 1994, SanCristobal et al. 2006, Winterø et al. 1994). Polymerase chain reaction (PCR) was done in eight multiplex reactions with a total volume of 17.0 µl comprised of 20 ng genomic DNA, 1.7 µl 10x standard buffer with Mg, 1.0 µl DMSO, 3 nM dNTPs (MP Biomedicals), 0.75 units of DNA Taq-Polymerase (Qbiogene, Heidelberg, Germany) and 5 pmol of each primer. The reaction was carried out on a PTC 200TM thermal cycler (MJ Research, Waltham, USA) under following conditions: an initial denaturation step at 94°C for 4 minutes followed by 37 cycles at 94°C for 30 seconds, annealing temperatures of each primer pair for 60 seconds and a final extension of 30 seconds at 72°C. All PCR-products were diluted in formamide loading dye (1:2–1:200). Gel electrophoresis was carried out on a 6% denaturing polyacrylamide gel (Rotiphorese Gel 40, Carl Roth, Karlsruhe, Germany) on a LI-COR 4300 DNA-Analyzer (LI-COR, Lincoln, NE, USA).
Statistical analysis
Quality control
Microsatellite genotypes were checked for presence of null alleles using the software MICRO-CHECKER (Van Oosterhout et al. 2004) to exclude genotyping errors. Significant deviation from Hardy-Weinberg equilibrium (HWE) of microsatellites was assessed with Chi-Square tests using SAS, version 9.4 (Statistical Analysis System, Cary, NC, USA). Markers significantly deviating from HWE after Bonferroni-correction for exact P-values (P0.05) in more than one population were not used for further analyses. Due to 12% missing genotypes at locus S0026, this marker was excluded from further analysis.
Quality and information content of each microsatellite was analysed over all populations using GenAlEx, version 6.501 (Peakall and Smouse 2006, Smouse and Peakall 2012) and SAS, version 9.4 (Statistical Analysis System, Cary, NC, USA) with estimating the total number of alleles (NA), the mean number of alleles per locus (MNA), the mean number of effective alleles per locus (MNE) as the number of equally frequent alleles, mean observed heterozygosity (HO), mean expected heterozygosity (HE), polymorphic information content (PIC) (Botstein et al. 1980) and the coefficients of gene differentiation FST (Nei 1977) and GST (Meirmans and Hedrick 2011, Nei 1987, Nei and Chesser 1983).
Genetic diversity within and among populations
Investigation of genetic diversity within and among the five pig populations under study firstly was done for the MiLe-SB of 2005 considered as a separated population from the offspring born at the LFG Ruthe. The intention was to clarify potential losses of alleles and genetic diversity and secondly regarding MiLe in total in comparison to GöMi, LWEast, LREast and Leico.
The NA, MNA, MNE and the mean number of alleles with a frequency of more than 0.05 per locus (Na Freq. ≥5%) were calculated for the particular populations with GenAlEx, version 6.501. Furthermore, this software was applied to estimate total and mean number of private alleles (PA and MPA) per locus, as alleles that are exclusively found in one population, HO and HE, Shannon`s Information Index (I) and Fixation Index (FIS) per population averaged over 39 microsatellites.
Effective population size (Ne) for each population was calculated according to the linkage disequilibrium method (Hill 1981, Waples 2006, Waples and Do 2010) applying the software NeESTIMATOR, version 2.1 (Do et al. 2014). This method requires unlinked marker and thus, we chose each one microsatellite marker per chromosome, whereby markers with highest mean heterozygosity and PIC were included.
Genetic differentiation among the five pig populations was investigated with F-Statistics and G-Statistics calculated using GenAlEx, version 6.501 as well as Nei’s standard genetic distance (D) (Nei 1972) and Cavalli-Sforza chord distance (DC) (Cavalli-Sforza and Edwards 1967) calculated using MSA, version 4.05 (Microsatellite Analyser (Dieringer and Schlötterer 2003)) and constituted as pairwise population matrices per parameter. Then, we performed a principal component analysis (PCA) based on FST (Weir and Cockerham 1984), D and DC calculated with MSA, version 4.05 to investigate genetic variation and differentiation of the different pig populations using procedure FACTOR of SAS, version 9.4 (Statistical Analysis System, Cary, NC, USA). Factors were extracted from eigenvalues larger than zero. A phylogenetic tree was constructed using DARwin, version 6.0.21 (Perrier and Jacquemoud-Collet 2006), inferred from the simple matching dissimilarity indices (Sokal and Michener 1958) using neighbor-joining algorithm (Saitou and Nei 1987). Dissimilarity analysis and tree construction was performed with 1,000 bootstraps and a data set with more than 50% complete genotyped marker per individual.
Population structure
For detection of possible admixture within the whole sample set, we inferred population structure using the Software STRUCTURE, version 2.3.4. (Falush et al. 2003, 2007, Hubisz et al. 2009, Pritchard et al. 2000). A Bayesian model-based algorithm is implemented in STRUCTURE to estimate the memberships of every individual and allele frequencies for a predefined number of k clusters. We started 10 runs with a burn-in value of 5,000 and iterations of 50,000 for k=2–10. The output was visualised using DISTRUCT, version 1.1 (Rosenberg 2004).
Results
None of the 39 investigated markers showed any evidence of null alleles or significant deviation from HWE after Bonferroni-correction in more than one population. The markers exhibited 355 alleles, ranging from 5 to 21. The mean PIC over all markers and five pig populations under study was 0.70 varying from 0.44 to 0.86. HO was 0.58 (0.30–0.76) and HE was 0.55 (0.27–0.77) (Table 1). The measures of genetic differentiation for each locus (FST, GST) were significant (P=0.001). The mean FST value over all populations and loci was 0.27, ranging from 0.07 in SW240 to 0.54 in SW2410.
Analysis of diversity within populations regarding MiLe-SB in comparison with MiLe-OF indicated lower MNA and MNE as well as lower HO and HE in the MiLe-OF, whereas the number of PA remained as similar in both subpopulations (Table 2). Diversity analysis of MiLe compared to the four pig populations under study revealed the smallest MNA and MNE within MiLe with 3.08 and 2.19 and LREast with highest MNA and MNE of 5.69 and 2.99. PA of 25 for MiLe was in- between Leico (16), LWEast (16) and GöMi (28), whereas MPA did not exceed 1.0 in all populations under study. The estimate of Ne in MiLe (13.3) was the smallest, whereas highest Ne was found in LREast (136.7). Mean heterozygosity levels per locus (HO and HE) were lowest in MiLe and GöMi and highest in LWEast and LREast. HO ranged from 0.49 in MiLe and GöMi to 0.64 in LWEast and LREast. HE was slightly smaller than HO in all populations and ranging from 0.47 to 0.60. FIS values were 0.00, –0.04 and –0.07 in GöMi, MiLe and LWEast, respectively.
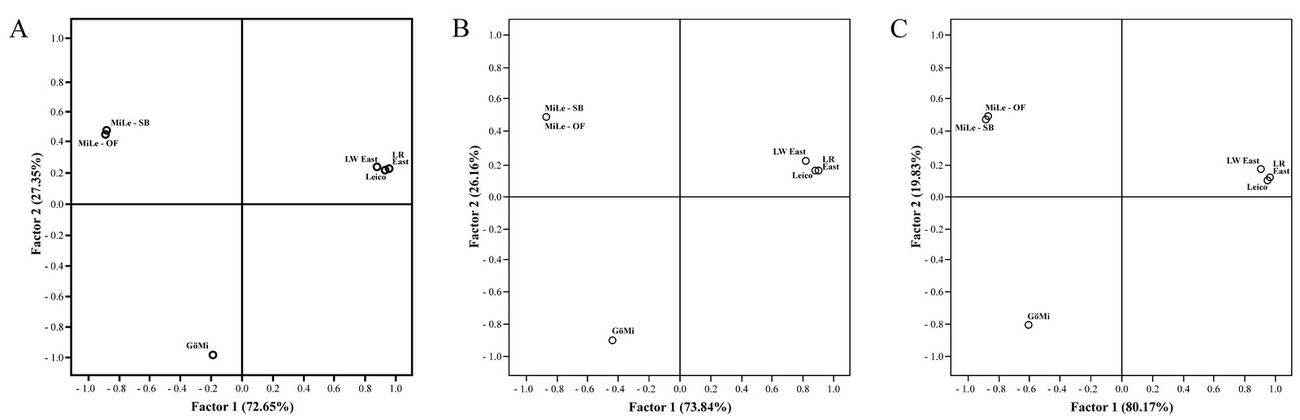
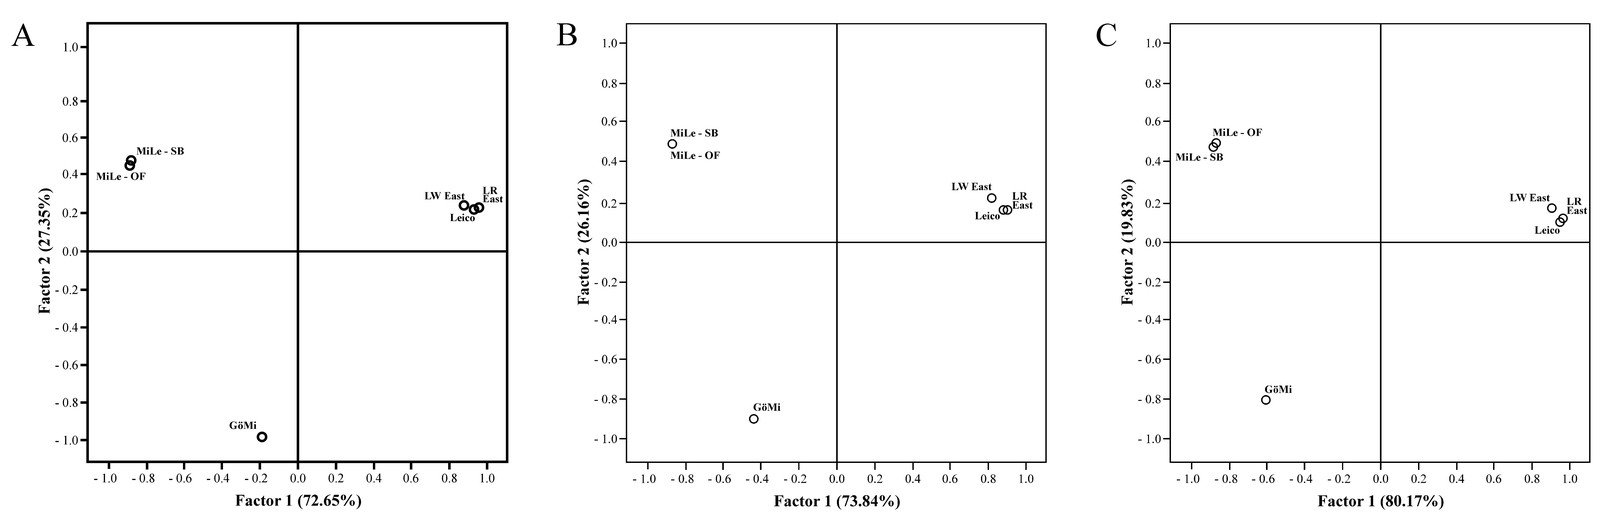
Genetic differentiation among populations according to F- and G-statistics was not significant between MiLe-SB and MiLe-OF and extremely low distances were also found according to D and DC (Tables 3 and 4). Accordingly, MiLe-OF exhibited only slightly higher distances to all four pig populations compared to MiLe-SB. Similar results were found for PCAs where a marginal variation between MiLe-SB and MiLe was apparent (Figure 4).
Regarding the MiLe in total in comparison to the four other pig populations under study, F- and G-statistics were significantly different between all five pig populations (Table 3). The greatest significant differences were found between MiLe and Leico (FST=0.246; GST=0.243), whereas the lowest significant differentiation was between LREast and Leico (FST=0.043; GST=0.035). The greatest distance was found between MiLe and Leico (D=0.744) and GöMi and LWEast (DC=0.723), whereas distances were lowest between Leico and LREast (D=0.111, DC=0.306) (Table 4). Generally, higher distances were obtained for MiLe to the non-miniature populations LWEast, LREast and Leico than to the miniature population GöMi.
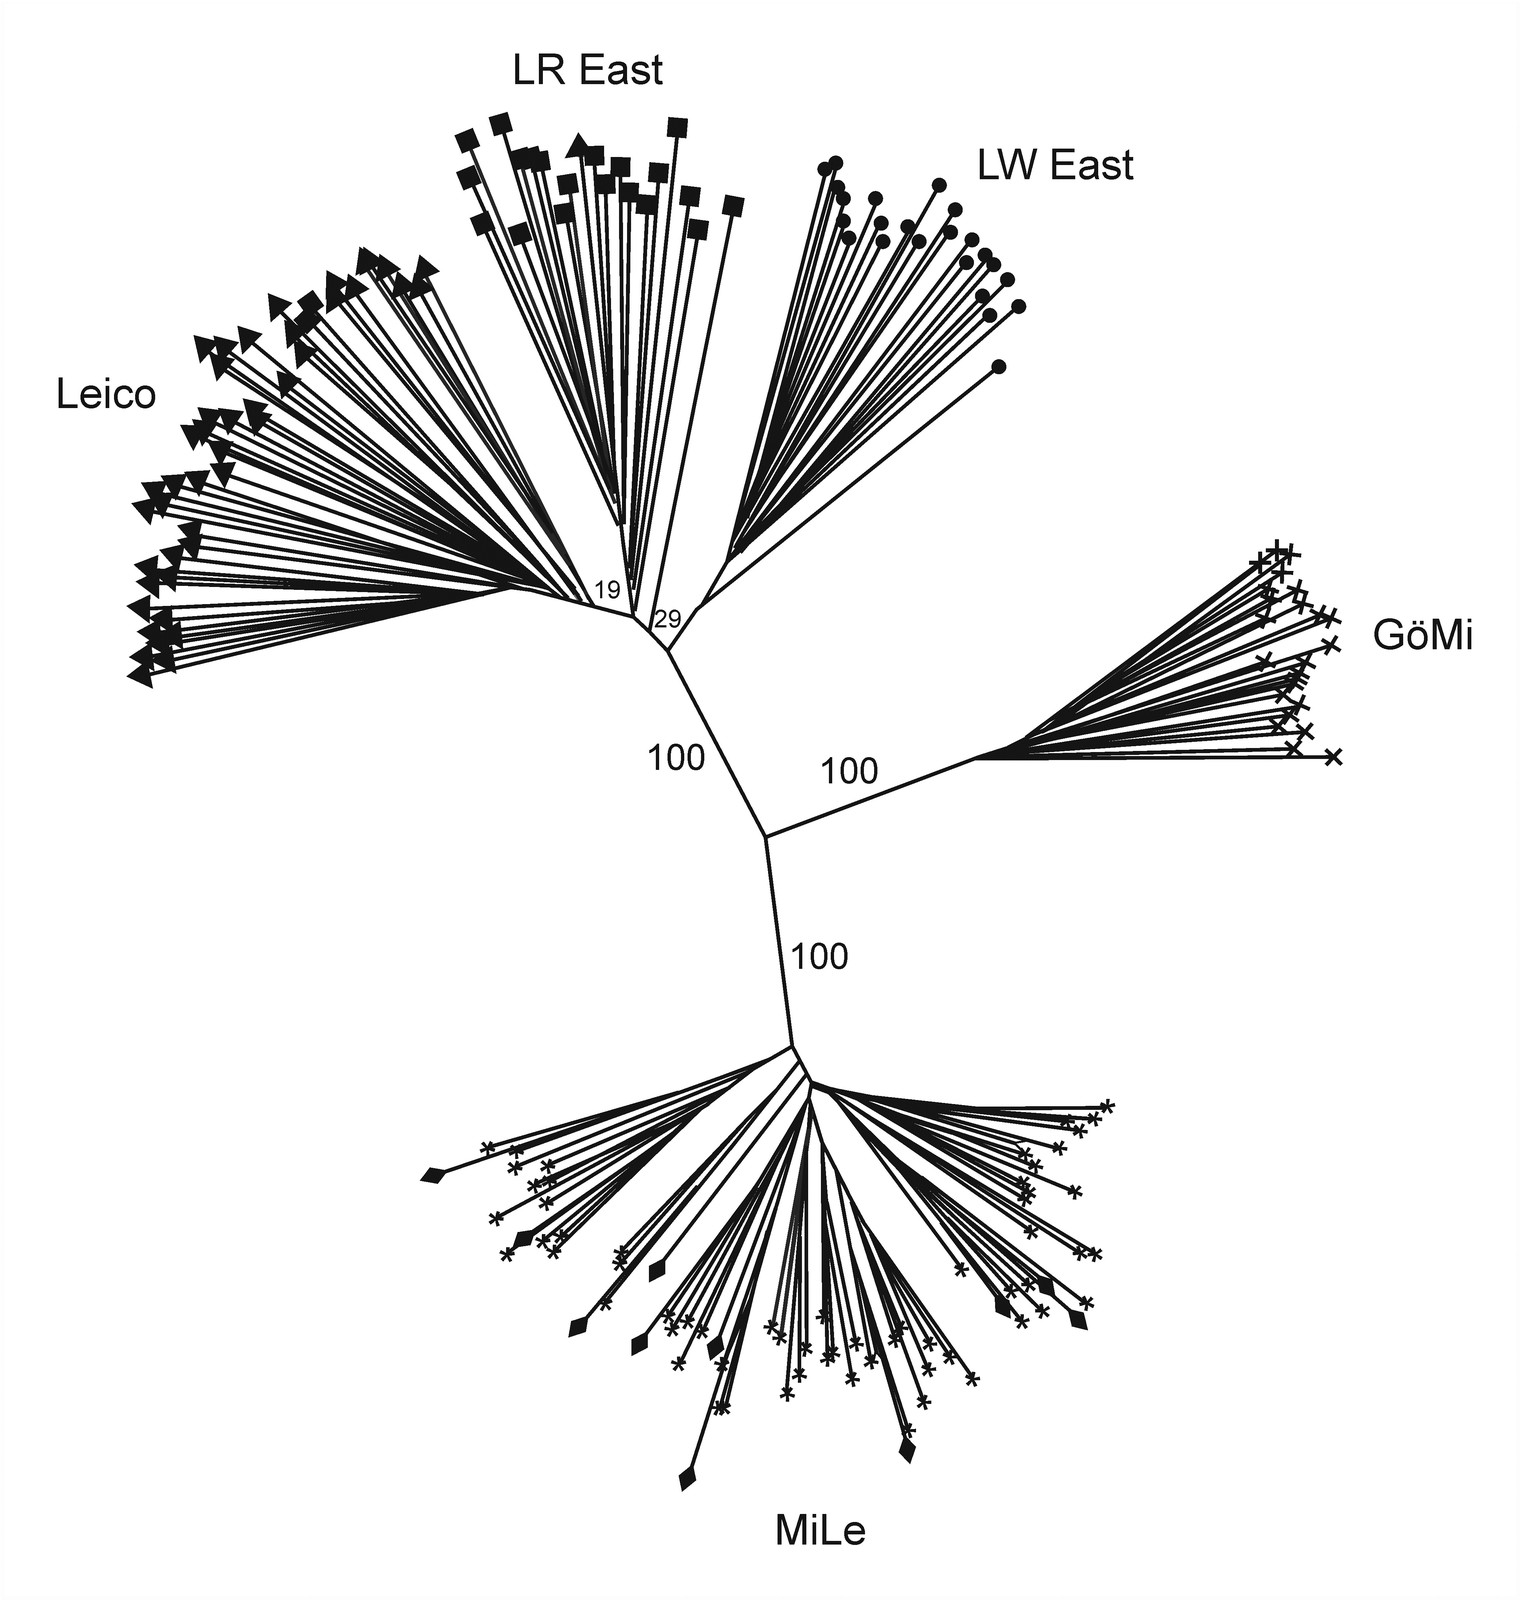
The individual-animal-based neighbor-joining dendrogram demonstrated a clear separation of the two miniature pig populations from each other as well as from the three non-miniature pig populations LWEast, LREast and Leico (Figure 5). LREast and Leico were the closest related populations with a small proportion of admixed individuals in both populations.
Two factors were sufficient to capture the variation of the genetic distance matrices among the five pig populations under study. The first and second PCA, based on DC, D and FST, explained similar large proportions of 70-80% and 20-30% of the total genetic variability. The PCAs of the different genetic distance matrices differentiated the five pig populations under study in three main groups with MiLe, GöMi and the three non-miniature pig populations LWEast, LREast and Leico. Factor 2 accounted for the differentiation between MiLe and GöMi. LWEast, LREast and Leico formed one group, whereby within this group LWEast segregated from LREast and Leico in both axes (Figure 4).
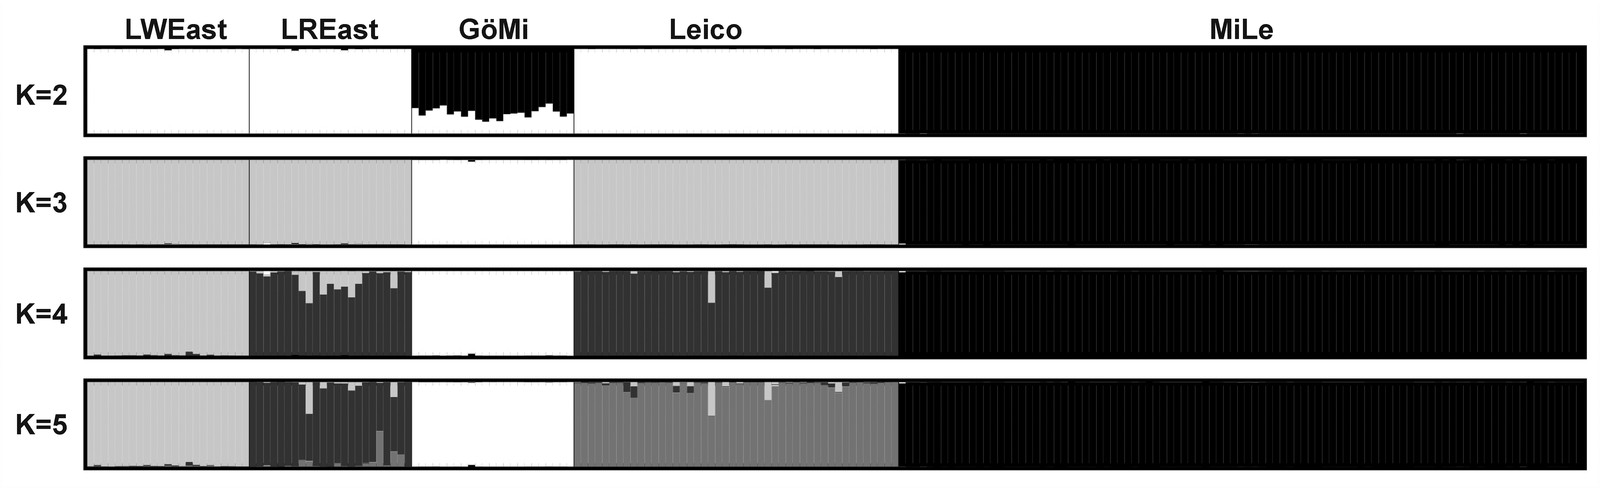
STRUCTURE analysis reached a maximum at k=5 clusters according to the maximum log (P(X/K) value. DISTRUCT plot indicated a division of miniature pig populations and non-miniature pig populations at k=2 (Figure 6). For k=3, MiLe and GöMi were discriminated, whereas LWEast, LREast, and Leico remained in one cluster. At k=4, LWEast separated from Leico and LREast and at k=5, Leico and LREast were finally separated in two different clusters. Membership estimates for cluster 2 and 3 were 99.7% for MiLe and - 99.6% for GöMi, whereas clusters 1, 2 and 5 were slightly admixed among LWEast, LREast and Leico (Table 5). Cluster 5 reached a membership estimate of 98.9% for LWEast, cluster 4 of 91.1% for LWEast and cluster 1 of 95.9% for Leico.
Discussion
The present study elucidated the genetic diversity and population structure of the miniature pig population MiLe based on 39 highly polymorphic microsatellite markers. A comparison between the start-up breeding population with 15 animals (MiLe-SB) to their offspring produced at the LFG Ruthe suggested a slight loss of genetic diversity, but the maintenance of characteristic genetic features of the MiLe. Measures of genetic differentiation indicated the MiLe population as a genetically distinguished and consistent pig population. Pig populations chosen for comparisons were assumed to express some degree of genetic relationship with the MiLe population through founder animals originating from the same breeds. Genetic diversity in MiLe was moderate in comparison to pig breeds analysed in previous studies.
Our comparison of the genetic diversity among MiLe-SB and MiLe-OF revealed a small proportion of alleles of being lost in MiLe-OF. Similar findings were obtained in a previous pedigree-based diversity analysis, where loss of founder genomes was due to inevitable passing of breeding animals (Schachler et al. 2019). However, lost alleles in the current study were not private for MiLe. We assume that this indicates a negligible loss of MiLe alleles. Genetic distance between MiLe-SB and MiLe-OF was not significant in analysis of genetic differentiation using FST and GST. That was also confirmed in the PCA, where only a marginal variation was apparent. Overall, our findings revealed preservation of genetic diversity of MiLe with only an inevitable loss of a small proportion of variation in this highly polymorphic marker set.
Genetic variation was lowest in the total MiLe population in comparison to LWEast, LREast and Leico. Similar or only slightly higher values were found for GöMi. In comparison to previous studies, extremely low genetic diversity was observed in the Ukrainian Poltava Meat (Kramarenko et al. 2018), in the French Basque pig and in the French Limousin pig (Laval et al. 2000). In a Portuguese Duroc population (Vicente et al. 2008) and a Taiwanese Lanyu pig (Chang et al. 2009) similar diversity levels were described as in the MiLe. Extremely high genetic diversity was found in several indigenous Chinese pig populations (Li et al. 2004) or in the Indian Ghurrah pig (Boro et al. 2019). Therefore, in comparison with previous studies genetic diversity estimated in MiLe reached a moderate level. Furthermore, the slightly greater HO than HE and the small negative FIS-value in MiLe can be associated with a mating system where inbreeding is avoided (Templeton and Read 2013). This is in line with the breeding program of MiLe at LFG Ruthe exploiting long generation intervals and matings among individuals with low relationship coefficients to keep increase in inbreeding as low as possible (Schachler et al. 2019). MiLe and GöMi populations showed a high MPA per locus such as 0.64 in MiLe to 0.72 in GöMi that was not found in previous studies. For example in Brazilian pig breeds, MPA per locus was from 0.11 to 0.46 (Sollero et al. 2009). The estimation of Ne was the smallest in MiLe with 13.3. Previous pedigree based diversity analysis demonstrated that the effective population size was kept on the same level from the start-up breeding population to the current population with 13.47 (Schachler et al. 2019). Therefore, the estimate of Ne based on molecular genetic data is strongly in accordance with the estimate from pedigree data. However, Ne in GöMi was nearly four times as large as in MiLe, though heterozygosity levels were similar in both populations. This indicated the presence of more alleles in GöMi than in MiLe as was shown with MNA and MNE, but occurred in heterozygous form as equally frequent as in MiLe.
The MiLe and GöMi had lowest diversity levels and lowest admixture with other pig populations using different genetic distance measures, neighbour-joining dendrogram and Bayesian clustering algorithm. These findings substantiated MiLe and GöMi as two different populations with low admixture.
Generally, there is an appreciable genetic variability among populations in the current study, considering the mean FST value of 0.27 over populations and loci. This means, that 27% of genetic variation could be explained by differentiation among the five populations. In previous investigations mean FST values from 0.02 in Brazilian pigs (Sollero et al. 2009) up to 0.28 in Croatian pig breeds (Gvozdanovic et al. 2018) were reported. Pairwise FST and GST values confirmed the large genetic variability among populations regarding qualitative guidelines for interpretation of FST (Hartl and Clark 1997, Wright 1978). It was suggested that FST values 0.05 indicate low genetic differentiation. A value between 0.05 and 0.15 is described as moderate, a value between 0.15 and 0.25 displays great and values >0.25 indicate very great genetic differentiation. Consequently, great distances were estimated between MiLe and GöMi and among both miniature pig populations, MiLe and GöMi to the non-miniature pig breeds LWEast, LREast and Leico. Leico and LWEast showed moderate differentiation as well as LWEast and LREast. LREast and Leico revealed low genetic differentiation. The almost equal patterns were seen for D and DC. The findings of PCA exemplified genetic relationships of MiLe to other pig breeds under study. In all PCAs, based on FST and equally on D and DC, MiLe and GöMi separated clearly from the non-miniature pig populations in two axes. However, segregation of MiLe and GöMi was caused by factor 2 accounting for about 30% of total genetic variability in investigated populations. Strong separation of individuals from MiLe and GöMi to the other pig populations under study as well as between each other was also confirmed by the individual-animal-based neighbor-joining dendogram and STRUCTURE analysis. Nevertheless, the small sample size of GöMi included in this study might not be representative for the whole GöMi population. Though, previous studies also found MiLe and GöMi as genetically separated populations. For example, a principal component analysis and neigbor-joining tree based on IBS distances (identity-by-state) inferred from whole-genome-sequencing data from small size of individuals as well as pooled samples were able to separate MiLe and GöMi as two populations, located between different Asian and European pig clusters (Reimer et al. 2018, 2020). The very high genetic distances of MiLe to other pig populations in the current analysis confirmed the closed breeding program performed in the MiLe, resulting in loss of genetic variation and enrichment of private alleles to a consistent population. This can also be seen in comparison of the present heterozygosity levels of MiLe-SB and MiLe-OF. Similar heterozygosity levels were found in the GöMi, a population that is also bred in a closed herdbook (Simianer and Köhn 2010) in five separated barrier facilities around the world (Reimer et al. 2020). Noticeable smaller genetic distances among LWEast, LREast and Leico indicated outbreeding and crossbreeding with other breeds.
Regarding the historical background of MiLe, a certain relationship especially between MiLe and Leico as well as LREast should be expected. However, only Leico and LREast showed a proportion of shared alleles. There was a forced breeding for lean meat and productivity in DvL and German Landrace after the Second World War (Comberg et al. 1978, Schwark et al. 1975). This led to a differentiation of the former DvL population of the GDR to the current Landrace population in Eastern Germany, represented as LREast in the current study. The breed Leico was established in course of a hybrid breeding program in the GDR to comprise a wide range of positive performance characteristics, that was introduced particularly by the German Landrace population in the GDR (Pfeiffer 1980), explaining the low genetic distance between Leico and LREast in this analysis. The genetic proportion of German Landrace in Leico was 49% in a study in 1991 (Neupert and Kalm 1991), which nowadays might be much lower regarding the results in our analysis. The great genetic distance between MiLe and LREast may be seen in the fact that the primary reason to use DvL as a founder breed for MiLe was to select for white skin and coat colour (Busse 1967). Other characteristic alleles of DvL went probably lost in MiLe, particularly due to the strong selection for low 140-day-body mass. Therefore, the genetic contributions of DvL to MiLe decreased probably already since the beginning of the MiLe breeding program.
This is the first study characterising genetic diversity and population structure in the miniature pig MiLe based on molecular genetic data. Our findings elucidate the MiLe as a population that has differentiated over 40 years from its founder breeds to a completely genetically separated population. It shows that the MiLe highly differs from GöMi, another miniature pig population used as animal model. There is an increase in use of miniature pigs as animal model in a wide range of areas in experimental research, where different minipig breeds are already consolidated for specific usages (Gutierrez et al. 2015, Schook et al. 2015). The demand of inbred-lines for defined genotypes and haplotypes, for example SLA-haplotypes (Hammer et al. 2020) is increasing, while the breeding goal for laboratory animals is the establishment of non-inbred populations with a sufficient genetic diversity (Pawlowsky et al. 2017). The present study shows that the MiLe is able to meet these requirements and represents an alternative animal model to the GöMi. Consequently, the MiLe is a suitable resource population for experimental research.
Acknowledgements
We thank Jörn Wrede for assistance with statistical analysis and acknowledge Ute Philipp, Cornelia Voß and Stefan Neander for their expert technical assistance in labaratory work.
Conflict of interest
The authors declare that they have no competing interests.
Ethics approval
Written informed consent was obtained from the pig owners to use their samples from the bio-bank for research purposes.
Funding
The authors received no specific funding for this work.
Authors contribution
KS, OD and JM analyzed and interpreted the microsatellite genotyping data.
Breeding program of the Mini-LEWE was designed by OD and CS.
JOM and CS managed the Mini-LEWE population at the LFG Ruthe.
KS drafted and finalized the manuscript.
All authors read and approved the final manuscript.
Address for correspondence
Dr. habil. Julia Metzger
Institute of Animal Breeding and Genetics
University of Veterinary Medicine Hannover
Bünteweg 17p
30559 Hannover
Julia.metzger@tiho-hannover.de
References
Alexander L, Rohrer G, Beattie C (1996a): Cloning and characterization of 414 polymorphic porcine microsatellites. Anim Genet 27: 137–148.
Alexander L, Troyer D, Rohrer G, Smith T, Schook L, Beattie C (1996b): Physical assignments of 68 porcine cosmid and lambda clones containing polymorphic microsatellites. Mamm Genome 7: 368–372.
Boro P, Patel B, Sahoo NR, Gaur G, Dutt T, Singh M, Naha B (2019): Genetic diversity analysis of Ghurrah pig based on microsatellite markers. Indian J Anim Sci 89: 903–905.
Botstein D, White RL, Skolnick M, Davis RW (1980): Construction of a genetic linkage map in man using restriction fragment length polymorphisms. Am J Hum Genet 32: 314–331.
Busse H (1967): Über weitere Maßnahmen zur Züchtung eines kleinen Versuchsschweines für medizinische Zwecke. Monatsh Veterinarmed 23: 949–954.
Cavalli-Sforza LL, Edwards AW (1967): Phylogenetic analysis: models and estimation procedures. Evolution 21: 550–570.
Chang W, Chu H, Jiang Y, Li S, Wang Y, Chen C, Chen K, Lin C, Ju Y (2009): Genetic variation and phylogenetics of Lanyu and exotic pig breeds in Taiwan analyzed by nineteen microsatellite markers. J Anim Sci 87: 1–8.
Comberg G, Behrens H, Bollwahn W, Fielder E, Glodek P, Kallweit E, Meyer H, Stephan E (1978): Schweinezucht. Eugen Ulmer, Stuttgart, 32–56.
Coppieters W, Van de Weghe A, Peelman L, Depicker A, Van Zeveren A, Bouquet Y (1993): Characterization of porcine polymorphic microsatellite loci. Anim Genet 24: 163–170.
Dieringer D, Schlötterer C (2003): Microsatellite analyser (MSA): a platform independent analysis tool for large microsatellite data sets. Mol Ecol Notes 3: 167–169.
Do C, Waples R, Peel D, Macbeth G, Tillett B, Ovenden J (2014): NeEstimator v2: re-implementation of software for the estimation of contemporary effective population size (Ne) from genetic data. Mol Ecol Resour 14: 209–214.
Durisin M, Seitz J, Reifenrath J, Weber C, Eifler R, Maier H, Lenarz T, Klose C (2016): A novel biodegradable frontal sinus stent (MgNd2): a long-term animal study. Eur Arch Otorhinolaryngol 273: 1455–1467.
Ellegren H, Johansson M, Chowdhary BP, Marklund S, Ruyter D, Marklund L, Bräuner-Nielsen P, Edfors-Lilja I, Gustavsson I, Juneja RK, Andersson L (1993): Assignment of 20 Microsatellite Markers to the Porcine Linkage Map. Genomics 16: 431–439.
Ellegren H, Chowdhary BP, Johansson M, Marklund L, Fredholm M, Gustavsson I, Andersson L (1994): A Primary Linkage Map of the Porcine Genome Reveals a Low Rate of Genetic Recombination. Genetics 137: 1089–1100.
Falush D, Stephens M, Pritchard JK (2003): Inference of population structure using multilocus genotype data: linked loci and correlated allele frequencies. Genetics 164: 1567–1587.
Falush D, Stephens M, Pritchard JK (2007): Inference of population structure using multilocus genotype data: dominant markers and null alleles. Mol Ecol Notes 7: 574–578.
FAO (2004): New microsatellite markers set – Recommendations of joints ISAG/FAO standing committee. In: Secondary Guidelines for development of national farm animal genetic resources management plans: Measurement of domestic animal diversity (MoDAD) recommended microsatellite markers. FAO, Rome.
Fredholm M, Winterø AK, Christensen K, Kristensen B, Nielsen PB, Davies W, Archibald A (1993): Characterization of 24 porcine (dA-dC) n-(dT-dG) n microsatellites: genotyping of unrelated animals from four breeds and linkage studies. Mamm Genome 4: 187–192.
GEH (The Society for the Conservation of Old and Endangered Livestock Breeds) (2020): Die Rote Liste der bedrohten Nutztierrassen in Deutschland. Available from: http//www.g-e-h.de/die-geh1/rote-liste. Accessed 16 March 2020.
Glodek P (1981): Enstehung und Züchterische Fortentwicklung. In: Glodek P, Oldigs B (Hrsg.), Das Göttinger Miniaturschwein. Paul Parey, Berlin, Hamburg, 9–17.
Gregor G (1976): Das Miniaturschwein „Mini-LEWE“ und seine Eigenschaften. Monatsh Veterinarmed 31: 624–629.
Gregor G, Leucht W (1976): Bedeutung, Zucht und Eigenschaften des Miniaturschweines. Forschungsberichte für die Landwirtschaft und Nahrungsgüterwirtschaft 14: 7–22.
Gundlach M (2012): Phänotypische Charakterisierung des Wachstums ausgewählter Röhrenknochen an Vorder- und Hinterextremität bei Miniaturschweinen der Rasse ‘Mini-LEWE’ mittels quantitativer Computertomographie. Stiftung Tierärztliche Hochschule Hannover, Diss.
Gutierrez K, Dicks N, Glanzner WG, Agellon LB, Bordignon V (2015): Efficacy of the porcine species in biomedical research. Front Genet 6: 293.
Gvozdanovic K, Margeta V, Margeta P, Djurkin Kušec I, Galovic D, Dovc P, Kušec G (2018): Genetic diversity of autochthonous pig breeds analyzed by microsatellite markers and mitochondrial DNA D-loop sequence polymorphism. Anim Biotechnol 1–10.
Hammer SE, Ho CS, Ando A, Rogel-Gaillard C, Charles M, Tector M, Tector AJ, Lunney JK (2020): Importance of the Major Histocompatibility Complex (Swine Leukocyte Antigen) in Swine Health and Biomedical Research. Annu Rev Anim Biosci 8: 171–198.
Hartl DL, Clark AG (1997): Principles of population genetics. Sinauer Associates Sunderland, Massachusetts.
Heyheim B, Keiserud A, Thornsen P (1994): A highly polymorphic porcine dinucleotide repeat S0302 (BHT 12) at chromosome 4p15. Anim Genet 25: 432–432.
Hill WG (1981): Estimation of effective population size from data on linkage disequilibrium. Genet Res 38: 209–216.
Hubisz MJ, Falush D, Stephens M, Pritchard JK (2009): Inferring weak population structure with the assistance of sample group information. Mol Ecol Resour 9: 1322–1332.
Jung M, Chen Y, Geldermann H (1994): Nine porcine polymorphic microsatellites (SO141–SO149). Anim Genet 25: 378–378.
Köhn F (2011): History and Development of Miniature, Micro-and Minipigs. In: McAnulty PA, Dayan AD, Ganderup NC, Hastings KL (eds.), The Minipig in Biomedical Research. CRC Press, Taylor and Francis Group, Boca Raton, Florida, 3–16.
Kramarenko S, Lugovoy S, Kharzinova V, Lykhach V, Kramarenko A, Lykhach A (2018): Genetic diversity of Ukrainian local pig breeds based on microsatellite markers. Regul Mech Biosyst 9: 177–182.
Krüger M, Zinne N, Biancosino C, Höffler K, Rajab TK, Waldmann KH, Jonigk D, Avsar M, Haverich A, Hoeltig D (2016): Porcine pulmonary auto-transplantation for ex vivo therapy as a model for new treatment strategies. Interact Cardiovasc Thorac Surg 23: 358–366.
Laval G, Iannuccelli N, Legault C, Milan D, Groenen MA, Giuffra E, Andersson L, Nissen PH, Jørgensen CB, Beeckmann P, Geldermann H, Foulley J-L, Chevalet C, Ollivier L (2000): Genetic diversity of eleven European pig breeds. Genet Sel Evol 32: 187–203.
Leucht W, Gregor G, Stier H (1982): Das Miniaturschwein, Versuchs- und Modeltier in Medizin und Biologie. VEB Gustav Fischer, Jena, 13–23.
Li S, Yang S, Zhao S, Fan B, Yu M, Wang H, Li M, Liu B, Xiong T, Li K (2004): Genetic diversity analyses of 10 indigenous Chinese pig populations based on 20 microsatellites. J Anim Sci 82: 368–374.
Meirmans PG, Hedrick PW (2011): Assessing population structure: FST and related measures. Mol Ecol Resour 11: 5–18.
Nei M (1972): Genetic distance between populations. Am Nat 106: 283–292.
Nei M (1977): F-statistics and analysis of gene diversity in subdivided populations. Ann Hum Genet 41: 225–233.
Nei M (1987): Molecular Evolutionary Genetics. Columbia University Press, New York.
Nei M, Chesser RK (1983): Estimation of Fixation Indices and Gene Diversities. Ann Hum Genet 47: 253–259.
Neupert B, Kalm E (1991): Schweinerassen aus den ostdeutschen Bundesländern im Test. Schweinezucht und Schweinemast 39: 100–101.
Panepinto LM (1996): Miniature Swine Breeds used Worldwide in Research. In: Tumbleson ME, Schook LB (eds.), Advances in Swine in Biomedical Research. Plenum Press, New York, London, New York, 681–691.
Patzak P (1994): Stereotaktischer und topographischer Atlas vom Hypothalamus des Miniaturschweines MINI-LEWE. Universität Leizig, Diss.
Pawlowsky K, Ernst L, Steitz J, Stopinski T, Kögel B, Henger A, Kluge R, Tolba R (2017): The aachen minipig: phenotype, genotype, hematological and biochemical characterization, and comparison to the göttingen minipig. Eur Surg Res 58: 193–203.
Peakall R, Smouse PE (2006): GENALEX 6: genetic analysis in Excel. Population genetic software for teaching and research. Mol Ecol Notes 6: 288–295.
Perrier X, Jacquemoud-Collet J (2006): DARwin software. http://darwin.cirad.fr/.
Pfeiffer H (1980): Enstehung des Hausschweines sowie Entwicklung und Eigenschaften einzelner Rassen. In: Pfeiffer H, Englisch HG, Hehne E, Lengerken Gv, Schlegel W, Triebler G, Pfeiffer H (Hrsg.), Schweinezucht. VEB Deutscher Landwirtschaftsverlag, DDR, Berlin, 31–66.
Pritchard JK, Stephens M, Donnelly P (2000): Inference of Population Structure using Multilocus Genotype Data. Genetics 155: 945–959.
Radermacher H (1999): Makroskopisch und mikroskopisch-anatomische Untersuchungen an Nieren und Nebennieren von Schweinen der Rasse Mini-LEWE und Deutsches Edelschwein nach Einwirkung operativer Belastungssituationen unter Berücksichtigung von Blutdruck und Herzfrequenz. Freie Universität Berlin, Diss.
Reimer C, Rubin CJ, Sharifi A, Ha NT, Weigend S, Waldmann KH, Distl O, Pant S, Fredholm M, Schlather M, Simianer H (2018): Analysis of porcine body size variation using re-sequencing data of miniature and large pigs. BMC Genomics 19: 1–17.
Reimer C, Ha NT, Sharifi AR, Geibel J, Mikkelsen LF, Schlather M, Weigend S, Simianer H (2020): Assessing breed integrity of Göttingen Minipigs. BMC Genomics 21: 308.
Richel N (2015): Phänotypische Charakterisierung der Entwicklung von Körpergewicht und-größe, Reproduktionsparametern und ausgewählten Blutinhaltsstoffen beim Miniaturschwein der Rasse „Mini-Lewe“. Cuvillier, Göttingen.
Riquet J, Milan D, Woloszyn N, Schmitz A, Pitel F, Frelat G, Gellin J (1995): A linkage map with microsatellites isolated from swine flow-sorted Chromosome 11. Mamm Genome 6: 623–628.
Robic A, Dalens M, Woloszyn N, Milan D, Riquet J, Gellin J (1994): Isolation of 28 new porcine microsatellites revealing polymorphism. Mamm Genome 5: 580–583.
Rohrer GA, Alexander LJ, Keele JW, Smith TP, Beattie CW (1994): A microsatellite linkage map of the porcine genome. Genetics 136: 231–245.
Rosenberg NA (2004): DISTRUCT: a program for the graphical display of population structure. Mol Ecol Notes 4: 137–138.
Saitou N, Nei M (1987): The neighbor-joining method: a new method for reconstructing phylogenetic trees. Mol Biol Evol 4: 406–425.
SanCristobal M, Chevalet C, Haley C, Joosten R, Rattink A, Harlizius B, Groenen M, Amigues Y, Boscher MY, Russell G, Law A, Davoli R, Russo V, De´saute´s C, Alderson L, Fimland E, Bagga M, Delgado J, Vega-Pla J, Martinez A, Ramos M, Glodek P, Meyer J, Gandini G, Matassino D, Plastow G, Siggens K, Laval G, Archibald A, Milan D, Hammond K, Cardellino R (2006): Genetic diversity within and between European pig breeds using microsatellite markers. Anim Genet 37: 189–198.
Schachler K, Suerie C, Minx J, Distl O, Metzger J (2019): Estimation of the genetic diversity in the Mini-Lewe breeding population and influence of inbreeding on litter traits. Zuchtungskd 91: 227–245.
Schook LB, Collares TV, Darfour-Oduro KA, De AK, Rund LA, Schachtschneider KM, Seixas FK (2015): Unraveling the swine genome: implications for human health. Annu Rev Anim Biosci 3: 219–244.
Schwark H, Ritter E, Ladan P (1975): Schweinerassen und ihre Bedeutung. In: Schwark HJ, Zebrowski Z, Ovsjânnikov V (Hrsg.), Internationales Handbuch der Tierproduktion: Schweine. VEB Deutscher Landwirtschaftsverlag, DDR, Berlin, 139–234.
Schwenke J (1998): Pathohistologische Myokardveränderungen bei Berliner Miniaturschweinen (Mini-Lewe) unter Berücksichtigung verschiedener Altersklassen. Freie Universität Berlin, Diss.
Simianer H, Köhn F (2010): Genetic management of the Göttingen Minipig population. J Pharmacol Toxicol Methods 62: 221–226.
Smouse R, Peakall R (2012): GenAlEx 6.5: genetic analysis in Excel. Population genetic software for teaching and research – an update. Bioinformatics 28: 2537–2539.
Sokal RR, Michener C (1958): A Statistical Method for Evaluating Systematic Relationships. Univ Kans Sci Bull 38: 1409–1438.
Sollero B, Paiva S, Faria D, Guimarães S, Castro S, Egito A, Albuquerque M, Piovezan U, Bertani G, Mariante AdS (2009): Genetic diversity of Brazilian pig breeds evidenced by microsatellite markers. Livest Sci 123: 8–15.
Templeton A, Read B (2013): Inbreeding: One word, several meanings, much confusion. In: Loeschcke V, Tomiuk J, Jain SK (eds.), Conservation Genetics. Birkhäuser Verlag, Basel, 101.
Van Oosterhout C, Hutchinson WF, Wills DP, Shipley P (2004): MICRO-CHECKER: software for identifying and correcting genotyping errors in microsatellite data. Mol Ecol Notes 4: 535–538.
Vicente A, Carolino M, Sousa M, Ginja C, Silva F, Martinez A, Vega-Pla J, Carolino N, Gama L (2008): Genetic diversity in native and commercial breeds of pigs in Portugal assessed by microsatellites. J Anim Sci 86: 2496–2507.
Wähner M (2012): Zucht und Produktionsziele in der Schweinezucht. In: Hoy S (Hrsg.), Schweinezucht und Ferkelerzeugung. Eugen Ulmer, Stuttgart, 27.
Waples RS (2006): A bias correction for estimates of effective population size based on linkage disequilibrium at unlinked gene loci. Cons Genet 7: 167–184.
Waples R, Do C (2010): Linkage disequilibrium estimates of contemporary Ne using highly variable genetic markers: a largely untapped resource for applied conservation and evolution. Evol Appl 3: 244–262.
Weir BS, Cockerham CC (1984): Estimating F-statistics for the analysis of population structure. Evolution 38: 1358–1370.
Winterø A, Fredholm M, Andersson L (1994): Assignment of the gene for porcine insulin-like growth factor 1 (IGF1) to chromosome 5 by linkage mapping. Anim Genet 25: 37–39.
Wright S (1978): Variability within and among Natural Populations. University of Chicago Press, Chicago, 84–85.
Zinne N, Krueger M, Hoeltig D, Tuemmler B, Boyle EC, Biancosino C, Hoeffler K, Braubach P, Rajab TK, Ciubotaru A, Rohde J, Waldmann KH, Haverich A (2018): Treatment of infected lungs by ex vivo perfusion with high dose antibiotics and autotransplantation: A pilot study in pigs. PLoS One 13: e0193168.


Kostenfreier Download
Klicken Sie hier, wenn Sie das PDF BMTW-10.23761439-0299-2020-15-Metzger.pdf (0.38 MB) herunterladen möchten
Kostenfreier Download
Klicken Sie hier, wenn Sie das PDF BMTW-10.23761439-0299-2020-15-Metzger-Tabelle1.pdf (0.12 MB) herunterladen möchten
Kostenfreier Download
Klicken Sie hier, wenn Sie das PDF BMTW-10.23761439-0299-2020-15-Metzger-Tabelle2.pdf (0.12 MB) herunterladen möchten
Kostenfreier Download
Klicken Sie hier, wenn Sie das PDF BMTW-10.23761439-0299-2020-15-Metzger-Tabelle3.pdf (0.12 MB) herunterladen möchten
Kostenfreier Download
Klicken Sie hier, wenn Sie das PDF BMTW-10.23761439-0299-2020-15-Metzger-Tabelle4.pdf (0.12 MB) herunterladen möchten
Kostenfreier Download
Klicken Sie hier, wenn Sie das PDF BMTW-10.23761439-0299-2020-15-Metzger-Tabelle5.pdf (0.12 MB) herunterladen möchten

